By looking at our systems through the lens of these three pillars, we can start to identify specific areas where we can improve our observability and get a clearer view of what’s happening in our environment.
Let’s go into more detail:
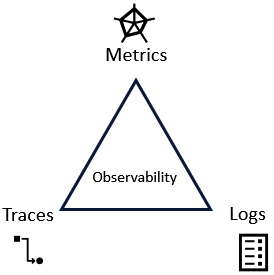
- Metrics: Metrics are quantitative measurements of system behavior, such as response time, error rate, and throughput. They provide a numerical view of system performance and help answer questions such as How fast? and How many?. Metrics are often collected using tools such as New Relic, Prometheus, or Datadog.Metrics provide a high-level view of system performance and help teams identify trends and patterns. They’re useful for monitoring resource utilization, response times, and error rates. Without metrics, teams might struggle to identify issues or optimize system performance.
- Logs: Logs are qualitative information about system behavior, such as events, errors, and warnings. They provide context and help answer questions such as What happened? and Why did it happen?. Logs are often collected using tools such as Elasticsearch, Logstash, Kibana (ELK), Splunk, or Sumo Logic.Logs provide context and detail about system behavior, helping teams understand the reasons behind metric fluctuations. They’re useful for investigating issues, identifying edge cases, and understanding how systems interact with each other. Without logs, teams might struggle to diagnose issues or understand system behavior.
- Traces: Traces are detailed, step-by-step records of system behavior, such as the path a request takes through a distributed system. They provide a complete picture of system behavior and help answer questions such as How did it happen? and What was the sequence of events?. Traces are often collected using tools such as OpenTelemetry, Jaeger, or Zipkin.Traces provide a complete picture of system behavior, showing the sequence of events and how they relate to each other. They’re useful for understanding complex distributed systems, identifying bottlenecks, and optimizing system performance. Without traces, teams might struggle to understand how systems interact with each other or identify performance bottlenecks.
In addition to supporting the three pillars of observability – metrics, logs, and traces – Azure Monitor also incorporates a fourth data type: changes. This broadens the scope of observability, providing a more complete view of the system’s behavior.